.png)

In many industrial applications, such as gears, rolling bearings, cam–follower systems, metal rolling, traction drives, and even electric vehicle transmissions, performance, efficiency, durability, and noise are governed by the friction ,viscosity and high-pressure rheological characteristics of the lubricant.
In rolling–sliding EHD contacts, friction is more accurately described as traction: the resistive force generated within the lubricated contact when relative sliding (or slip) occurs between the surfaces of components that are undergoing rolling motion. The thin lubricant film (typically < 1 micron) is subject to high contact pressures and high shear stresses in such non-conformal contacts. The rheological characteristics of confined fluids is described using piezo-viscous effect and the oil behaves like 'a solid' under such conditions, supporting shear stresses without being squeezed from the contact (Figure 1). This piezo-viscous property of the fluid leads to an exponential increase in fluid viscosity, by 6 orders of magnitude, at a contact pressure of 1 GPa.

The shear stress vs strain behavior dictates the traction response under EHD conditions. Traction directly influences:
As machine designs push toward higher loads, higher speeds, smaller contacts, and lower-viscosity lubricants, understanding lubricant friction and traction behavior is no longer optional—it is essential. This is where traction tribometers become indispensable tools for lubricant formulation, selection, and validation
Two fundamental curves are used to describe friction in lubricated contacts: the Stribeck curve and the traction curve. While they are sometimes confused or used interchangeably, they describe different aspects of lubricant behavior based on the lubrication regime. Stribeck applies more to surface interactions whereas traction better describes the molecular interactions within the EHD fluid.

The Stribeck curve (Figure 2) describes how the coefficient of friction varies as a function of lubrication regime. It is typically plotted as friction coefficient versus the Hershey parameter combining speed, viscosity, and load (often η·N/P). The curve illustrates three main regimes:
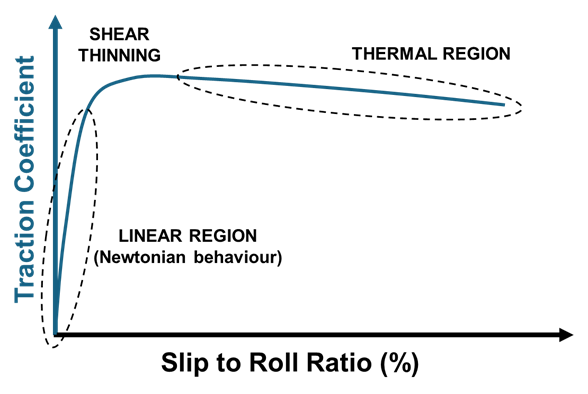
Traction curve plots traction coefficient vs. slide–roll-ratio (SRR) at constant load, speed, and temperature and can be differentiated into three regimes —
The traction curve can be interpreted as the high-pressure shear stress vs. shear strain behavior of the EHD oil film with shear strain analogous to SRR and shear stress being the resistive force exerted by the film. An important parameter that can be determined from traction plot data is the limiting shear stress (LSS), which is the maximum resistive force that a lubricant can sustain in a high-pressure contact with increasing SRR.
The LSS can be calculated from traction measurements – as the product between the traction coefficient at the plateau and the mean contact pressure, approximated using the maximum Hertzian pressure, as follows:

From an engineering perspective, limiting shear stress directly influences the maximum torque or force that can be transmitted through lubricated contacts, making it especially critical in traction drives and continuously variable transmissions. It also plays a role in controlling frictional heating and wear, since it caps the shear forces generated within the lubricant film.
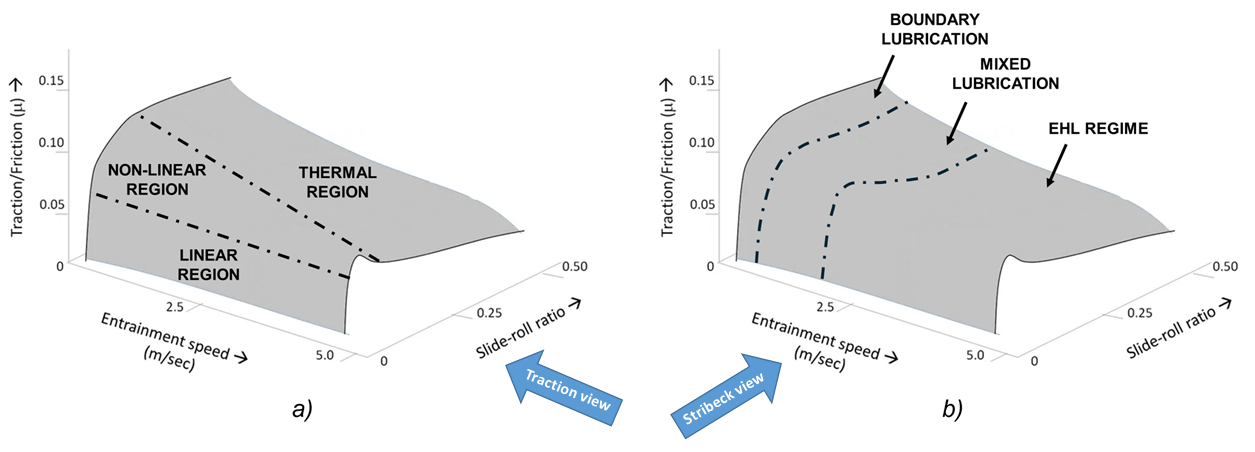
Traction and friction can be represented in a 3D plot (Figure 4) as a function of entrainment speed and slide roll ratio (SRR). The different regimes of lubrication relevant for friction and the different regimes of traction are approximated with dotted lines.
Base oils and viscosity index improvers determine overall viscosity, temperature dependence and piezo-viscous behavior , while friction modifiers and antiwear additives form protective tribo-layers that reduce friction. Lubricant friction behaviour is not dictated by viscosity alone. Multiple formulation components influence both Stribeck and traction curves, often in different ways.
Many applications require low Stribeck friction and stable traction characteristics; and such behavior can be classified as 'good' Traction and Stribeck curves (Table 1) that is a useful metric to compare and differentiate lubricants

Rolling-sliding motion can be generated and lubricant friction and traction behavior evaluated using two standard configurations:
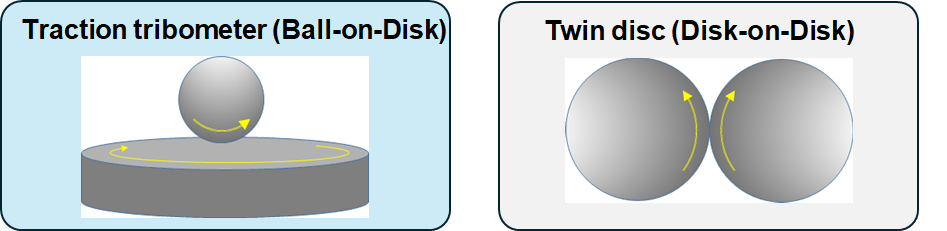
Both setups use independent drives to control speeds of ball and disc to achieve variable SRR, variable entrainment speed to map friction across lubrication regimes with each test configuration having its own strengths and limitations. Traction tribometer offers a compact, easy to use benchtop setup to quickly test lubricants both oils and greases. Furthermore, the quantity of oil required per test, typically 50 cc is ten times less compared to the twin disc setup. Twin disc setup is significantly bigger and requires higher loads (several kN) compared to traction tribometer (10's of N) to achieve the same contact pressure. As a result, greater frictional heat dissipation occurs and the traction behavior is expected to be dominated by thermal effects. However, the ability to accommodate the surface finish and directionality, as well as the materials/coatings used in gears offers better laboratory simulation of the transmission system compared to the traction tribometer.
Learn more about the Modular Traction Tribometer (MTT) here

To introduce the most important parameters, let’s consider a ball (1) on disk (2) configuration that are rotating at two different rpm resulting in two different sliding speeds (U1 and U2, respectively) at the contact. The following parameters can be defined:
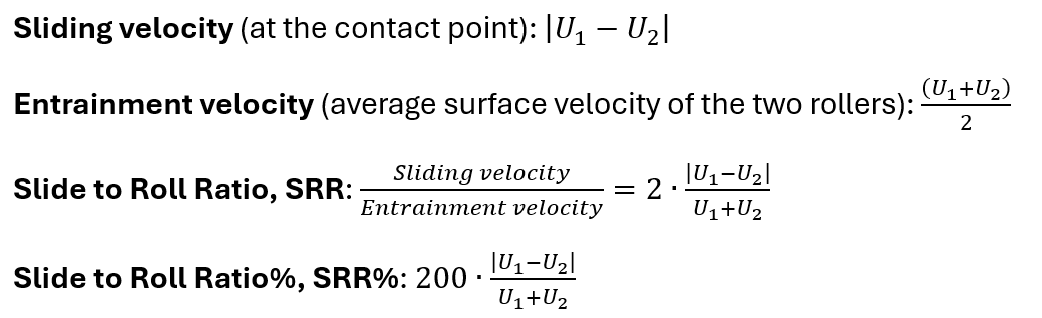
If U1 = 0, the two rollers are in pure sliding motion (SRR = 2); if U2 = U1, the two rollers are in pure rolling motion (SRR = 0).
Test standards to evaluate traction and friction of lubricants are not available and are currently under discussion within the standards committee. Within the lubricants community, the method(s) used rely on varying SRR at fixed entrainment speed (for traction) and varying entrainment speed at fixed SRR (for friction). This is based on first principle understanding of lubricated rolling-sliding contacts (Figure 4).
Within the scope of such methods, different speed profiles can be programmed:
By systematically varying slide–roll ratio, entrainment speed traction tribometers can effectively test lubricants to reveal their shear and frictional characteristics and identify the best formulations. The case studies presented in the next section focus on using the speed ramp profile to generate traction curves in 5 minutes.
Access the quick guide to setup, execute and analyze Tractiion data using LabIQ interface here
The materials and testing conditons for traction are summarized in Table 2.

The range for SRR was selected from -0.5 to +0.5 covering both -ve and +ve values. This was chosen to capture the transition from -ve to +ve friction force readings and establish the zero-reference point for SRR. Each test condition was repeated thrice on the same track without changing the ball and disc.

Fairly repeatable and consistent traction curves were obtained for both linearly increasing and decreasing SRR ramp protocols (Figure 6). Both +ve and -ve offsets were observed in friction compared to the zero SRR reference indicating hysteresis. Ball and disc speed profiles as well as ECR plots are shown in Figure 7.

A better representation of the traction behavior can be obtained by taking the average of data obtained from both increasing and decreasing SRR profiles .
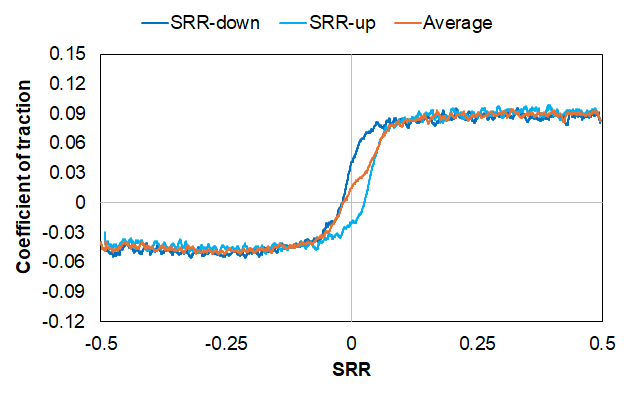
The average traction data for consecutive tests with SRR increasing and SRR decreasing is shown in Figure 8 with the traction data being more consistent and nearly zero close to the zero SRR reference point. Furthermore, a difference is observed in the maximum traction coefficient for both -SRR values and +SRR values. The limiting shear stress value calculated using a maximum traction coefficient of 0.085 obtained at 40 deg C and contact pressure of 1.0 GPa is 85 MPa.
The modular traction tribometer (MTT) is a versatile tool designed to support both conventional mechanical systems and emerging technologies such as electric vehicles. By measuring friction and traction under realistic rolling–sliding conditions, it provides engineers with the insights they need to optimise efficiency, reliability, and performance, bridging the gap between laboratory testing and real-world operation.
.svg)
.svg)
