.png)
Traction curve plots friction vs. slide-roll-ratio (SRR) at constant load, temperature and entrainment speed - conditions representative of EHL contacts. The MTT provides a versatile interface to execute a traction protocol i.e., a linear variation of SRR under constant entrainment velocity while simultaneously measuring friction and electrical contact resistance. The initial and final SRR can be varied between -1 and +1 with a maximum entrainment velocity upto 2 m/sec. The advanced software calculates and executes the ball and disc speed profiles based on the input conditions.
LabIQ is a powerful and easy to use software interface that guides users through 5 steps to set up a test and obtain traction data. The sequence starts with material definition - defining load profile - defining motion profile - environment and additional sensors - and finally executing the test.
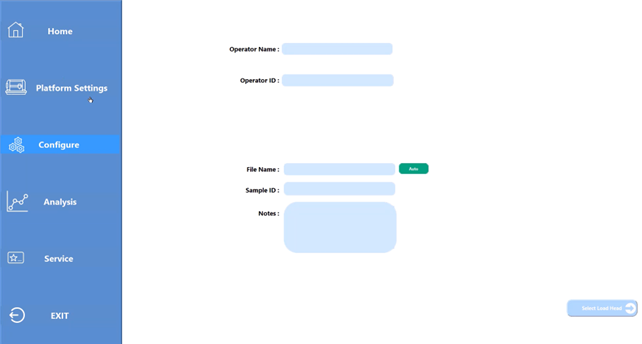
On the LabIQ Home screen, enter the test and operator details: Operator Name, Operator ID, File Name, Sample ID and Notes. These parameters are tagged with the raw data to ensure traceability.
Once all the information is uploaded, click on Select Load Head
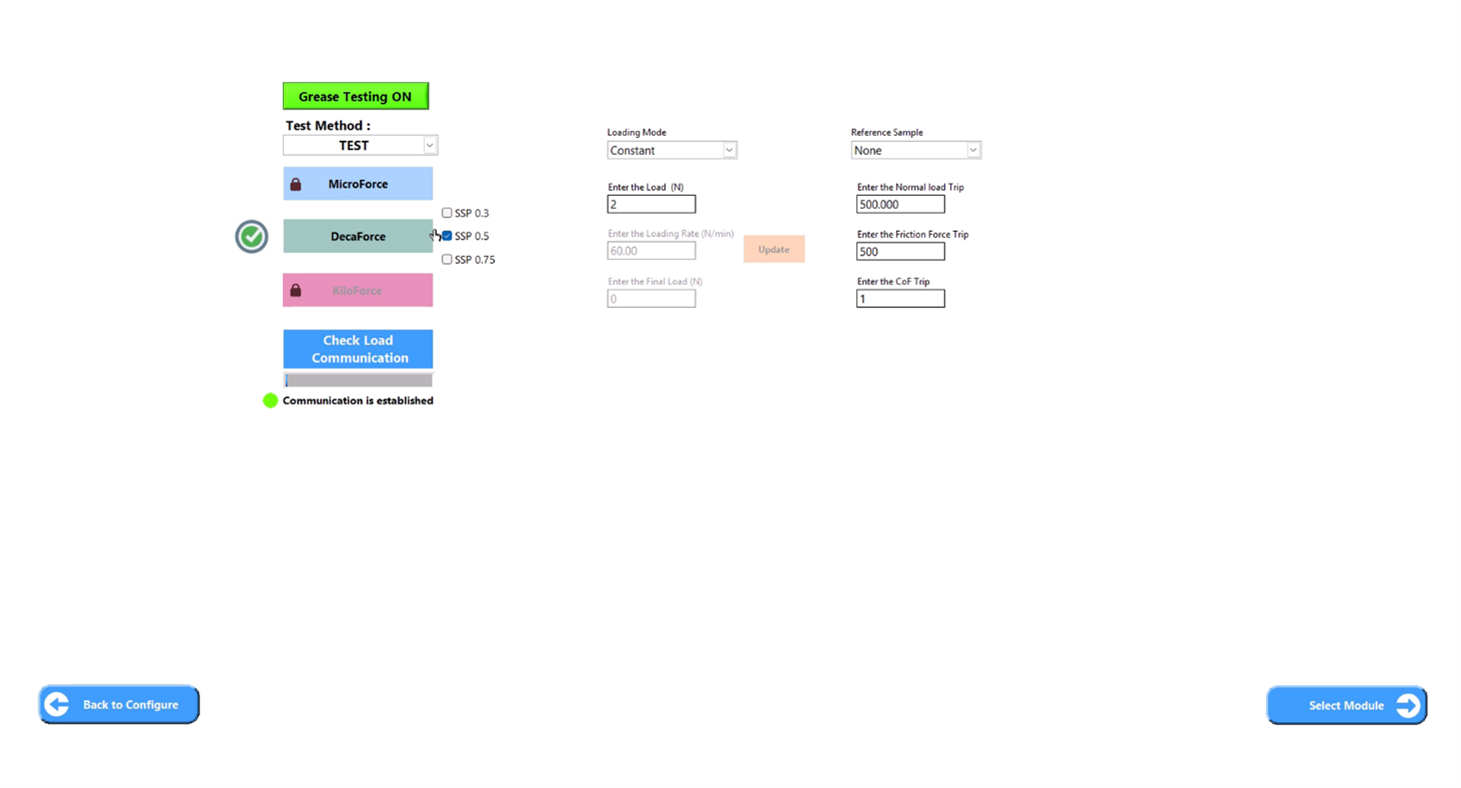
Depending on the instrument configuration, select the Load Head which defines the range of applied loads. DecaForce (2 to 200 N) is typically used and the default option. Furthermore, the loading profile can be set as Constant, Stepped or Ramp. and the operator can program the values, together with the trip values which work as emergency threshold values at which the test automatically stops.
Click on Select Motion Module for the next step.
Several Motion Modules (red area) can be configured on MTT; click on Traction to set up a test protocol.
The Motion settings (green area) offer flexibility to execute tests with a variable wear track diameter on the lower disc. Furthermore, users can seelct Constant, Stepped or Ramp speed profiles and program the values. For Traction curve, select Ramp Speed and variable SRR, Enter Initial and Final SRR and fixed Entrainment velocity
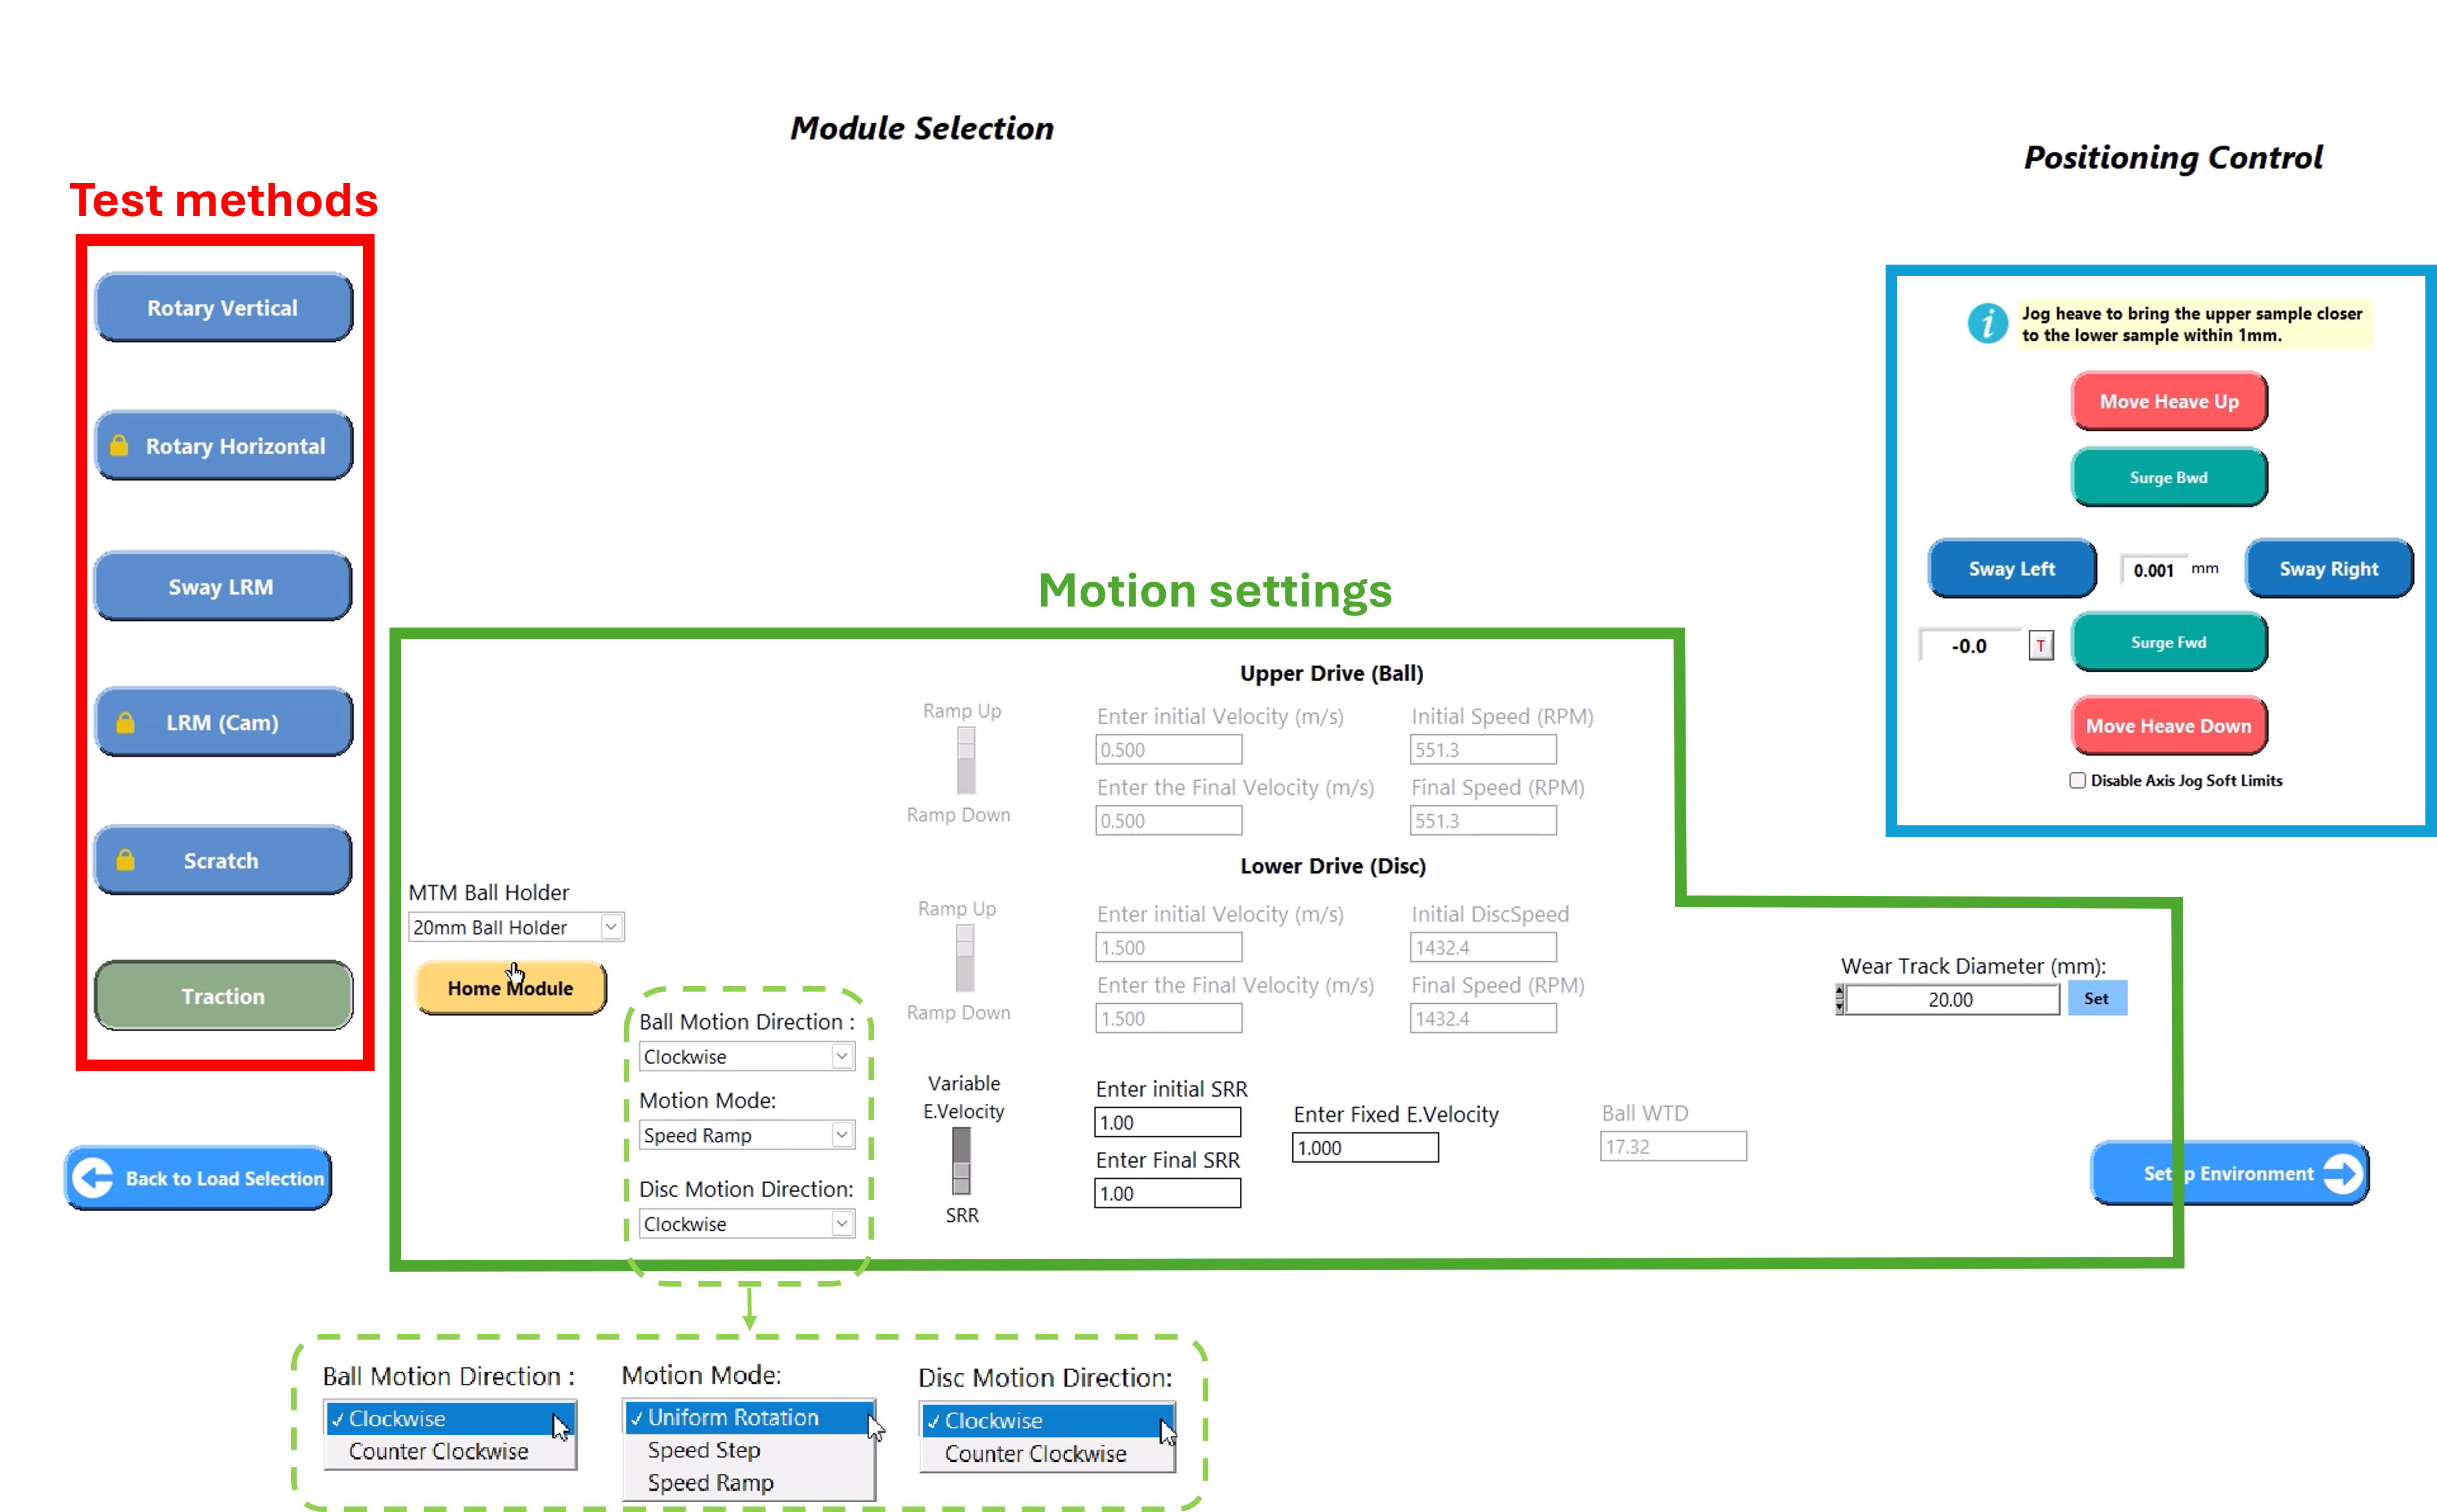
Click on Set up Environment.
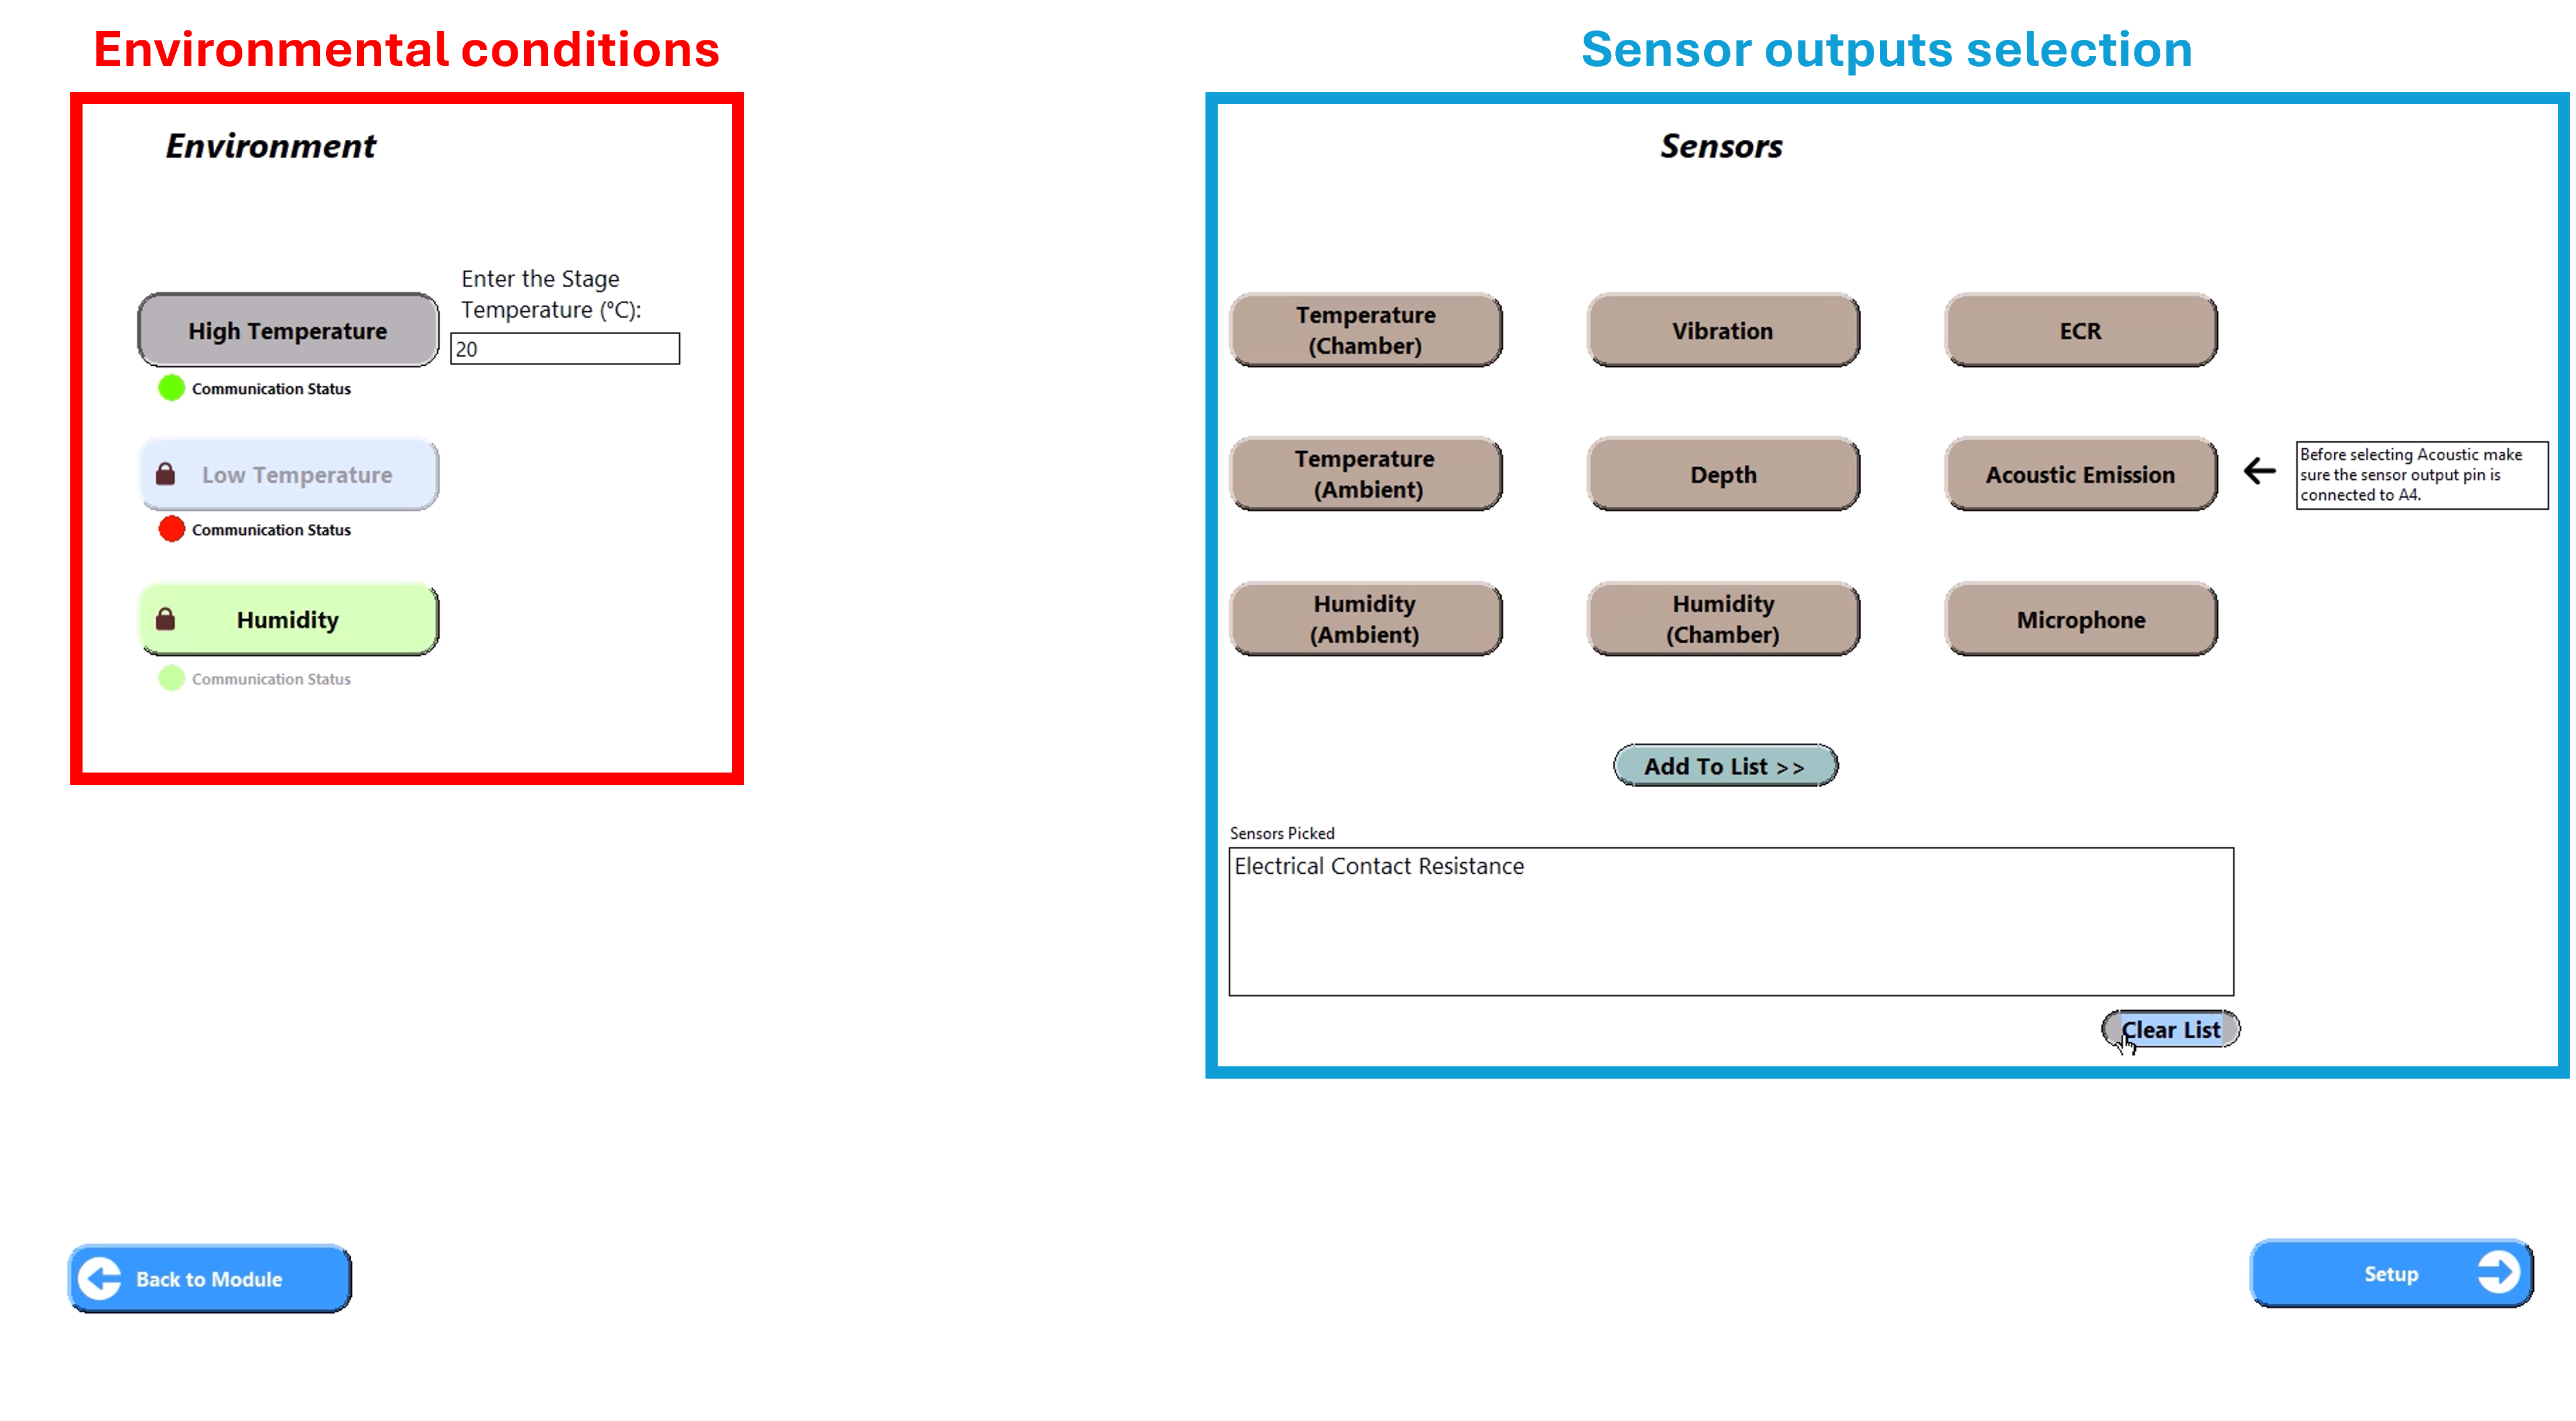
Lubricant cup heating can be enabled under Environmental conditions (red area) with temperature monitoring. Additional sensors such as electrical contact resistance can be chosen to actively record signals during the traction test.
The ECR (Electrical Contact Resistance) during the sliding is the signal that gives an insight on how the film thickness behaves during the test.
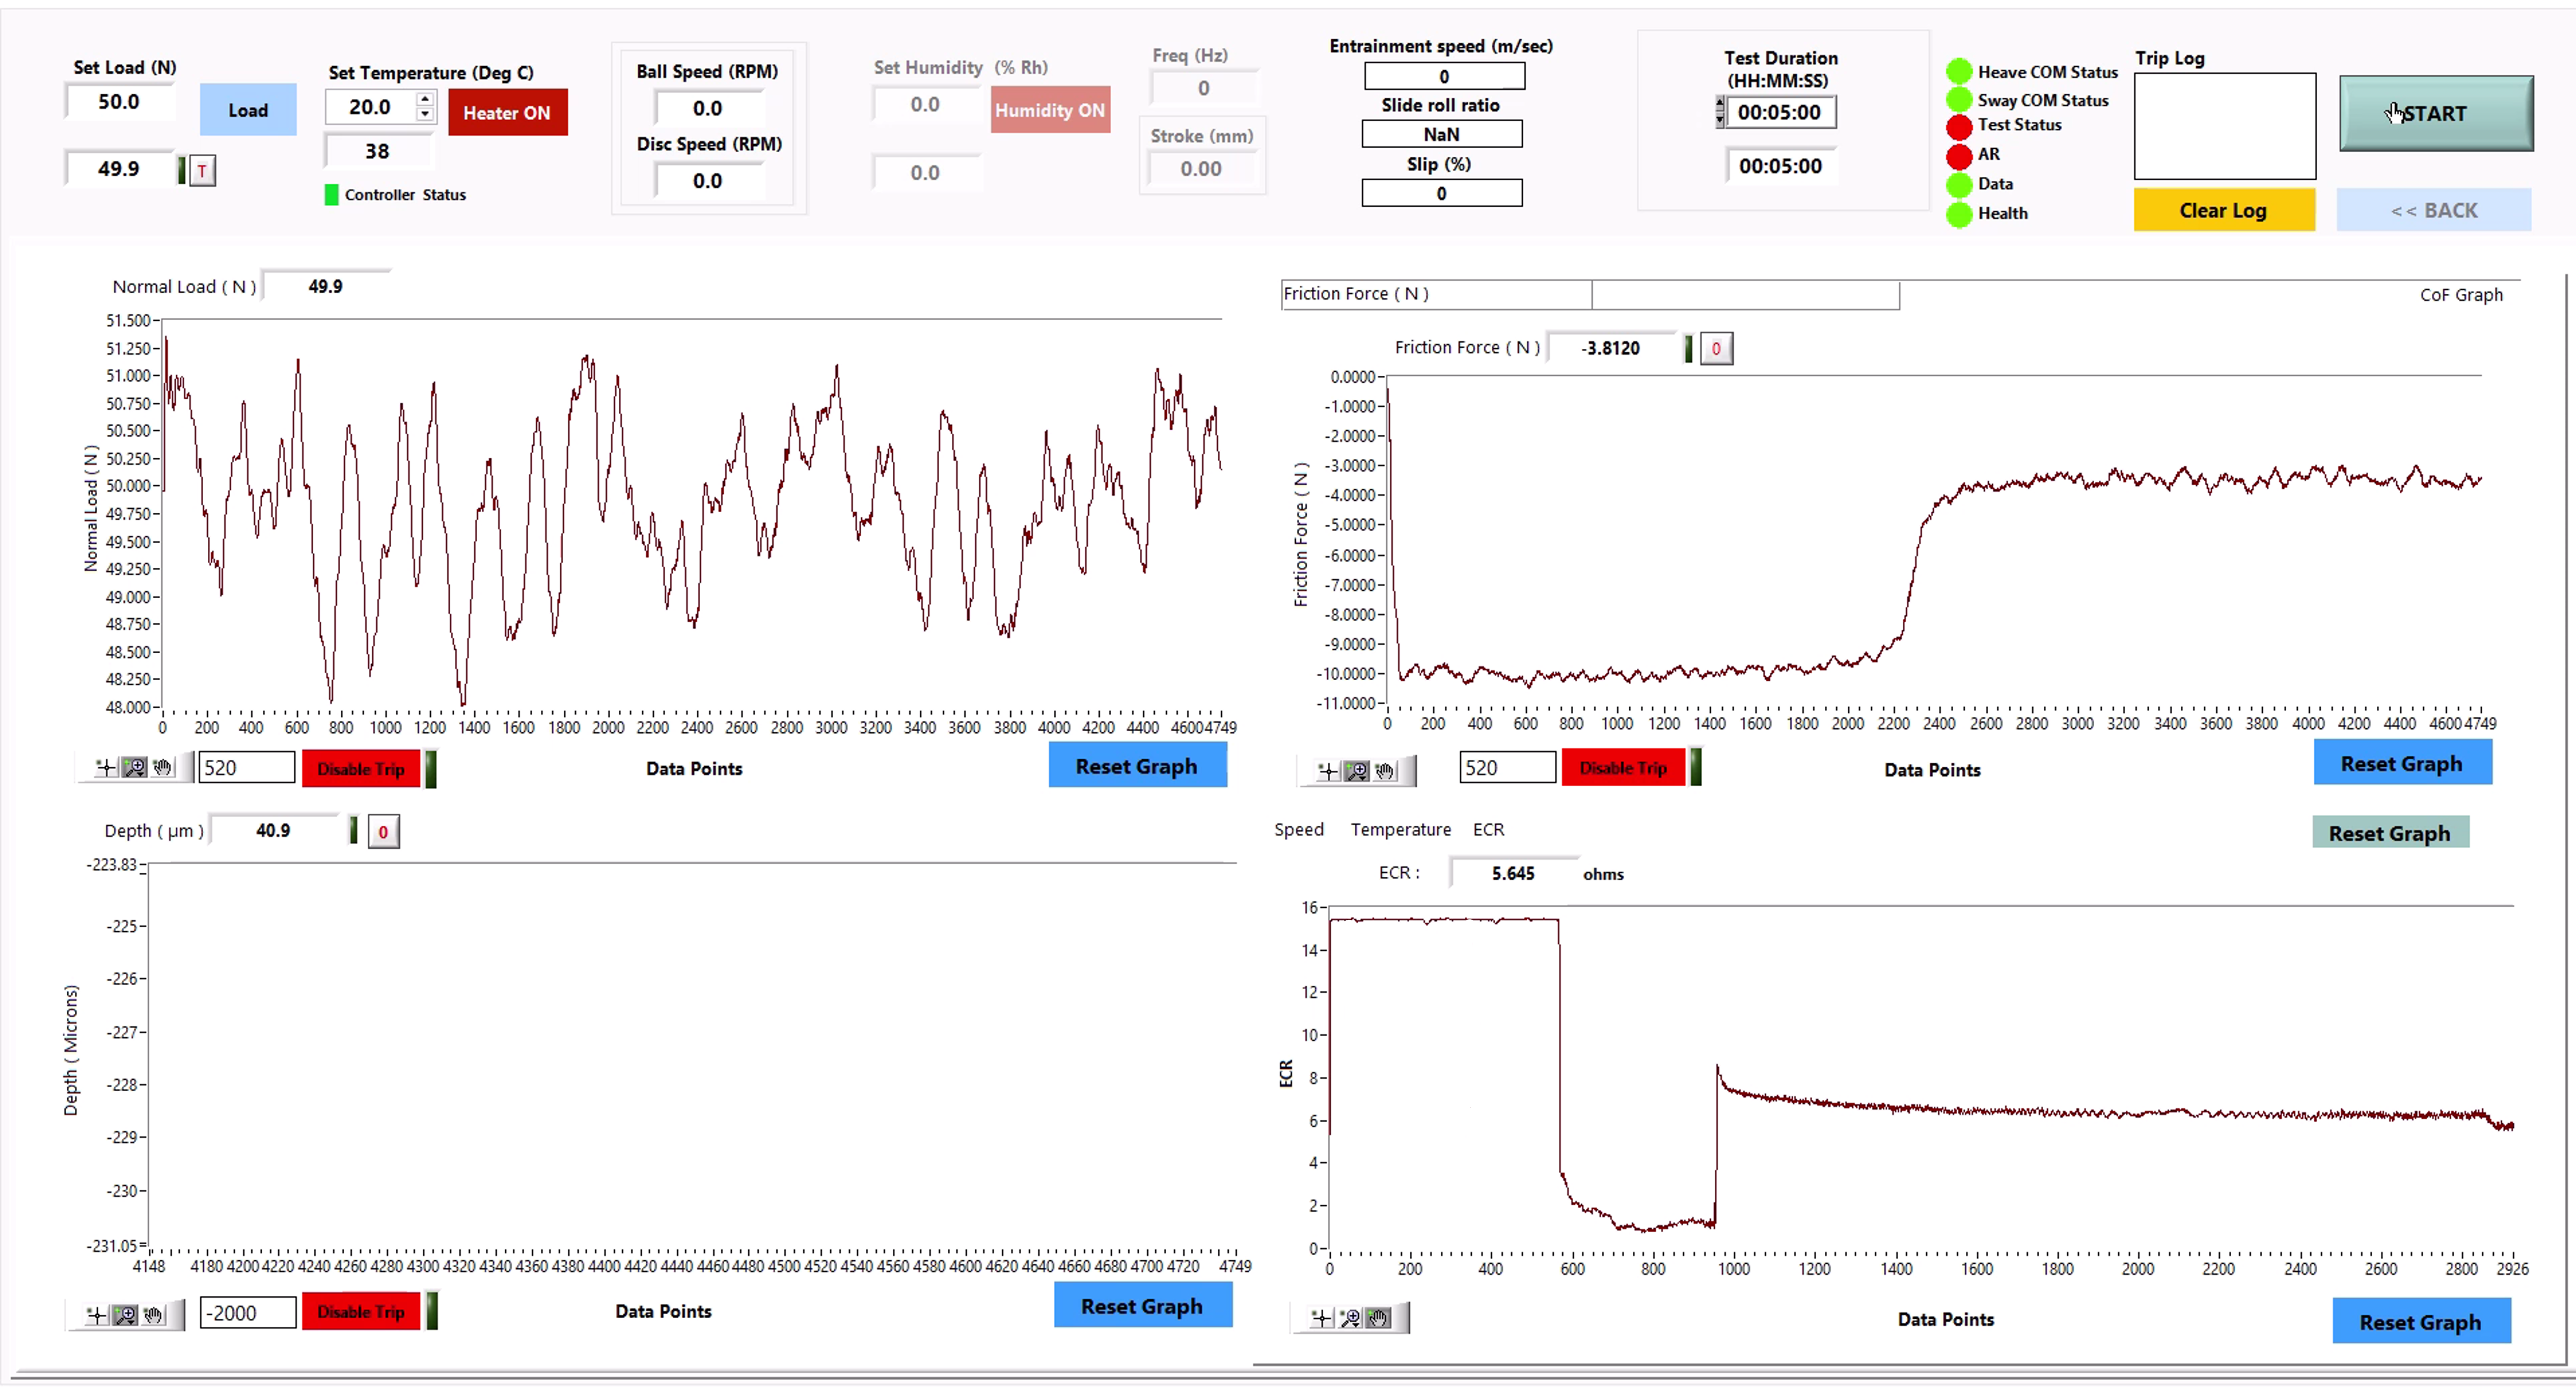
Set the test duration, typically 5 mins for a Traction test. All parameters are monitored across four separate windows. The raw data is saved as a simple text file with appropriate headers and can be exported for further analysis.
.svg)
.svg)
